


 Grafana Slow Query
This document was translated by GPT-4
# 1. Slow Query
# 1.1 Enabling debug mode
Add debug=true search parameter in grafana url, for example:
http:?debug=true
http:?xx=xx&debug=true
1
2
2
# 1.2 Viewing querier time consumption
Press F12 key to pull up the debug page, the following methods are detailed using Chrome as an example:
Browser viewing
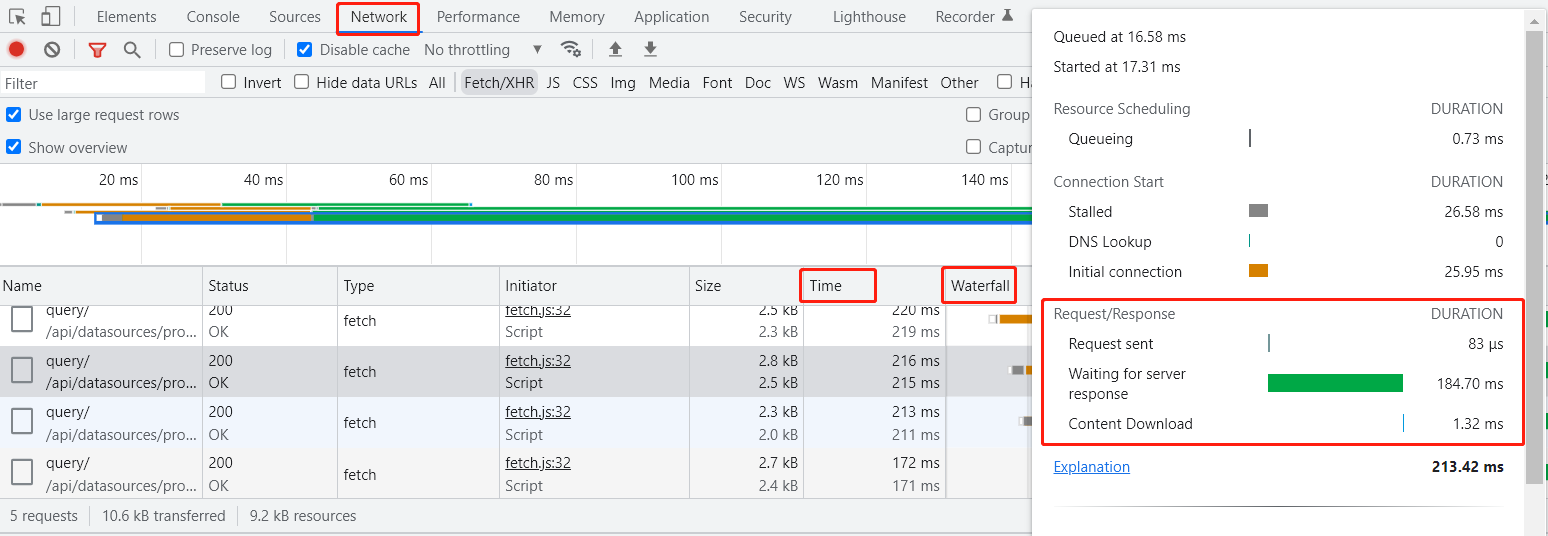
- Click on the Network tab to view detailed scenario of API time consumption.
- From the Time column, you can see the overall time taken by the API.
- The Waterfall lets you intuitively spot the APIs that take longer. The longer the horizontal green (or blue) column, the more time consumed.
- Hovering over a horizontal column on the waterfall chart displays further details, usually focusing on Waiting and Content Download items.
- The former generally represents the time consumed by the server-side API.
- The latter represents the time from the first reply package of the API to the last, often used in conjunction with the
Sizecolumn in the table - the larger the content, the longer it takes to transmit.
Note: You need to first open the F12 debug box and refresh the page to view API call information. Generally, you can switch menus after opening F12, click on the clear icon in the second row and the second column in the upper left corner of the picture above, and then switch back to the menu that needs troubleshooting to view.
# 1.3 Viewing ClickHouse time consumption
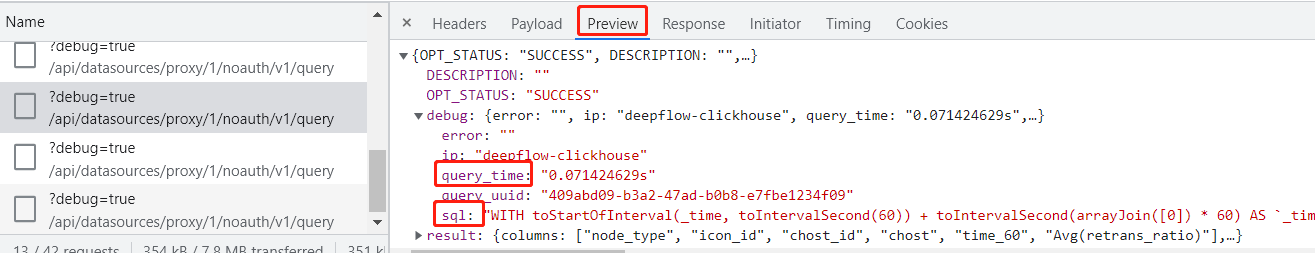
In the Network tab, you can see the execution time of SQL statements in ClickHouse in the Preview tab by clicking a specific API.
Browser viewing
- By looking at the debug field, you can see the following contents:
- sql represents the specific SQL statement executed in ClickHouse.
- query_time represents the execution time of the SQL statement itself.