


 SkyWalking Data Import
This document was translated by GPT-4
# 1. Data Flow
# 2. Configure OpenTelemetry SkyWalking Receiver
# 2.1 Background Information
You can check the OpenTelemetry documentation (opens new window) for background knowledge on OpenTelemetry. You can also read the previous section on the OpenTelemetry installation for a quick installation.
You can refer to the SkyWalking documentation (opens new window) for background information on SkyWalking. This Demo does not require a full SkyWalking installation. Instead, we will use OpenTelemetry to integrate SkyWalking Trace data.
# 2.2 Check OpenTelemetry Version
First, you need to enable OpenTelemetry's SkyWalking data receiving capabilities. The data will be processed by the OpenTelemetry standard protocol and passed to DeepFlow Agent.
There are bugs in OpenTelemetry receiving SkyWalking data. We have recently made fixes in #11562 (opens new window) and #12651 (opens new window). For the following demonstration, we need the Collector mirror (opens new window) version of OpenTelemetry >= 0.57.0. Please check the image version of otel-agent in your environment and make sure it meets the requirements. You can refer to the previous section on OpenTelemetry installation to update the otel-agent version in your environment.
# 2.3 Configure OpenTelemetry to Receive SkyWalking Data
After installing OpenTelemetry as described in the Background Information section, we can proceed with the following steps to configure OpenTelemetry to receive SkyWalking data:
Assuming the namespace where OpenTelemetry resides is open-telemetry, and the ConfigMap used by the otel-agent is named otel-agent-conf, use the command below to modify the otel-agent configuration.
kubectl -n open-telemetry edit cm otel-agent-conf
Add the following content in the receivers section:
receivers:
  # add the following config
  skywalking:
    protocols:
      grpc:
        endpoint: 0.0.0.0:11800
      http:
        endpoint: 0.0.0.0:12800
2
3
4
5
6
7
8
In the service.pipelines.traces section, add the following:
service:
  pipelines:
    traces:
      # add receiver `skywalking`
      receivers: [skywalking]
2
3
4
5
Ensure that otel-agent-conf has finished the corresponding configuration according to the section on configuring otel-agent.
Next, use the command below to modify otel-agent Service and open the corresponding port:
kubectl -n open-telemetry patch service otel-agent -p '{"spec":{"ports":[{"name":"sw-http","port":12800,"protocol":"TCP","targetPort":12800},{"name":"sw-grpc","port":11800,"protocol":"TCP","targetPort":11800}]}}'
Check the address of the SkyWalking OAP Server (opens new window) configured in your application and modify it to the Otel Agent's Service address: otel-agent.open-telemetry. Make sure that the environment variable SW_AGENT_COLLECTOR_BACKEND_SERVICES=oap-server:11800 is modified to SW_AGENT_COLLECTOR_BACKEND_SERVICES=otel-agent.open-telemetry:11800.
The reporting address configured by your application may take various forms, so please modify it according to the actual startup command of your application. For Java applications, you just need to make sure that you can modify the injected address in the startup command, such as -Dskywalking.collector.backend_service=otel-agent.open-telemetry:11800.
Finally, restart otel-agent to complete otel-agent update:
kubectl rollout restart -n open-telemetry daemonset/otel-agent
# 3. Configure DeepFlow
Please refer to the Configure DeepFlow section to complete the configuration of the DeepFlow Agent.
# 4. Experience Based on the WebShop Demo
# 4.1 Deployment of the Demo
This demo is sourced from this GitHub repository (opens new window). It is a WebShop application composed of five microservices written based on Spring Boot. The architecture is as follows:
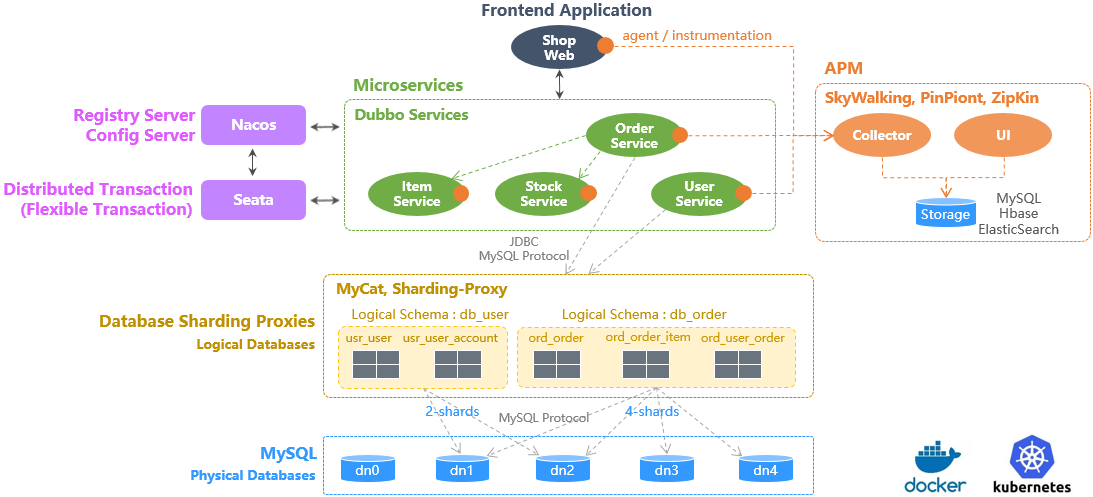
Sping Boot Demo Architecture
Use the following command to deploy this demo with one click. The address for reporting has been configured for this demo, so no further modifications are needed.
kubectl apply -f https://raw.githubusercontent.com/deepflowio/deepflow-demo/main/DeepFlow-Otel-SkyWalking-Demo/deepflow-otel-skywalking-demo.yaml
# 4.2 View Tracing Data
Go to Grafana, open the Distributed Tracing Dashboard, select namespace = deepflow-otel-skywalking-demo, and then select a call for tracing.
DeepFlow is capable of displaying the tracing data obtained from SkyWalking, eBPF, and BPF in a single Trace flame graph, covering the full-stack call path of a Spring Boot application from business code, system functions, to network interfaces, thereby achieving true full-link distributed tracing. The effect is as follows:

OTel SkyWalking Demo
You can also visit the DeepFlow Online Demo (opens new window) to see the effect.