


 Service Topology
This document was translated by GPT-4
# 1. Service Topology
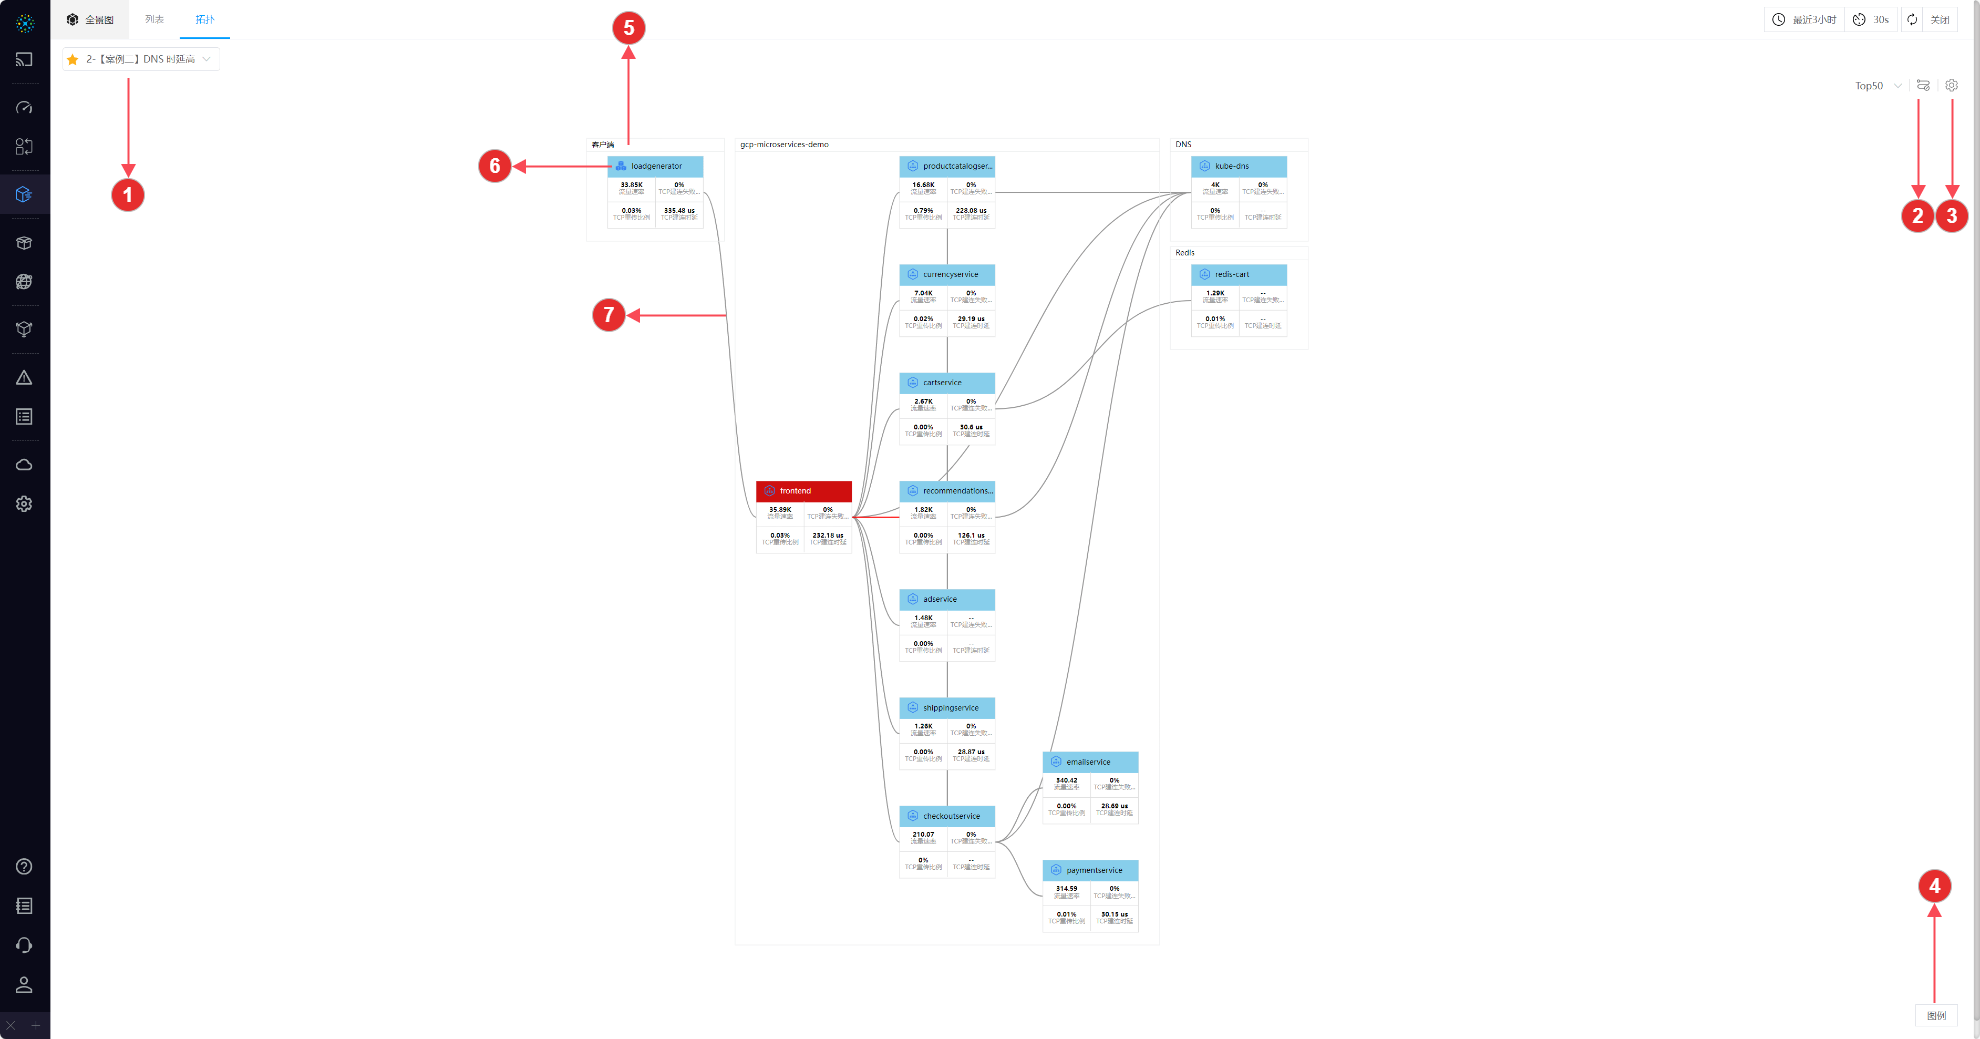
Displaying the services defined by users in business definitions in a waterfall topology format.
01-Service Topology
- ① Business Switch Dropdown Box: Quick switch between businesses, default to the first starred business
- ② Service Management: Click the button to enter the business details page
- ③ Settings: Support
viewing APIs,adding to viewsetc. - ④ Legend: Understand the semantics of the ICONs
- ⑤ Service Group: Consist of
name row+box, such as client, gcp-microservices-demo, DNS, Redis are independent service groups - ⑥ Service: Each block in the topology represents a service, composed of a
name row+metric quantity, hover over to see the TIP, click to see the service details via the right slide box, see the following sections for explanations- Name Row: The ICON expresses the service type
- Metric Quantity: Only the metric quantity showing the service as the server is displayed. When the metric quantity exceeds the threshold, both the name row and its corresponding metric quantity will be marked in red
- ⑦ Path: Represents the actual data path for the client visiting the server, hover over to see the TIP, click to see the path details via the right slide box, see the following sections for explanations
# 1.1 Right Slide Box
Click on Service or Path to enter the right slide box and view its detailed information. The right slide box is composed of the upper Invocation Topology and lower TAB.
# 1.1.1 Invocation Topology
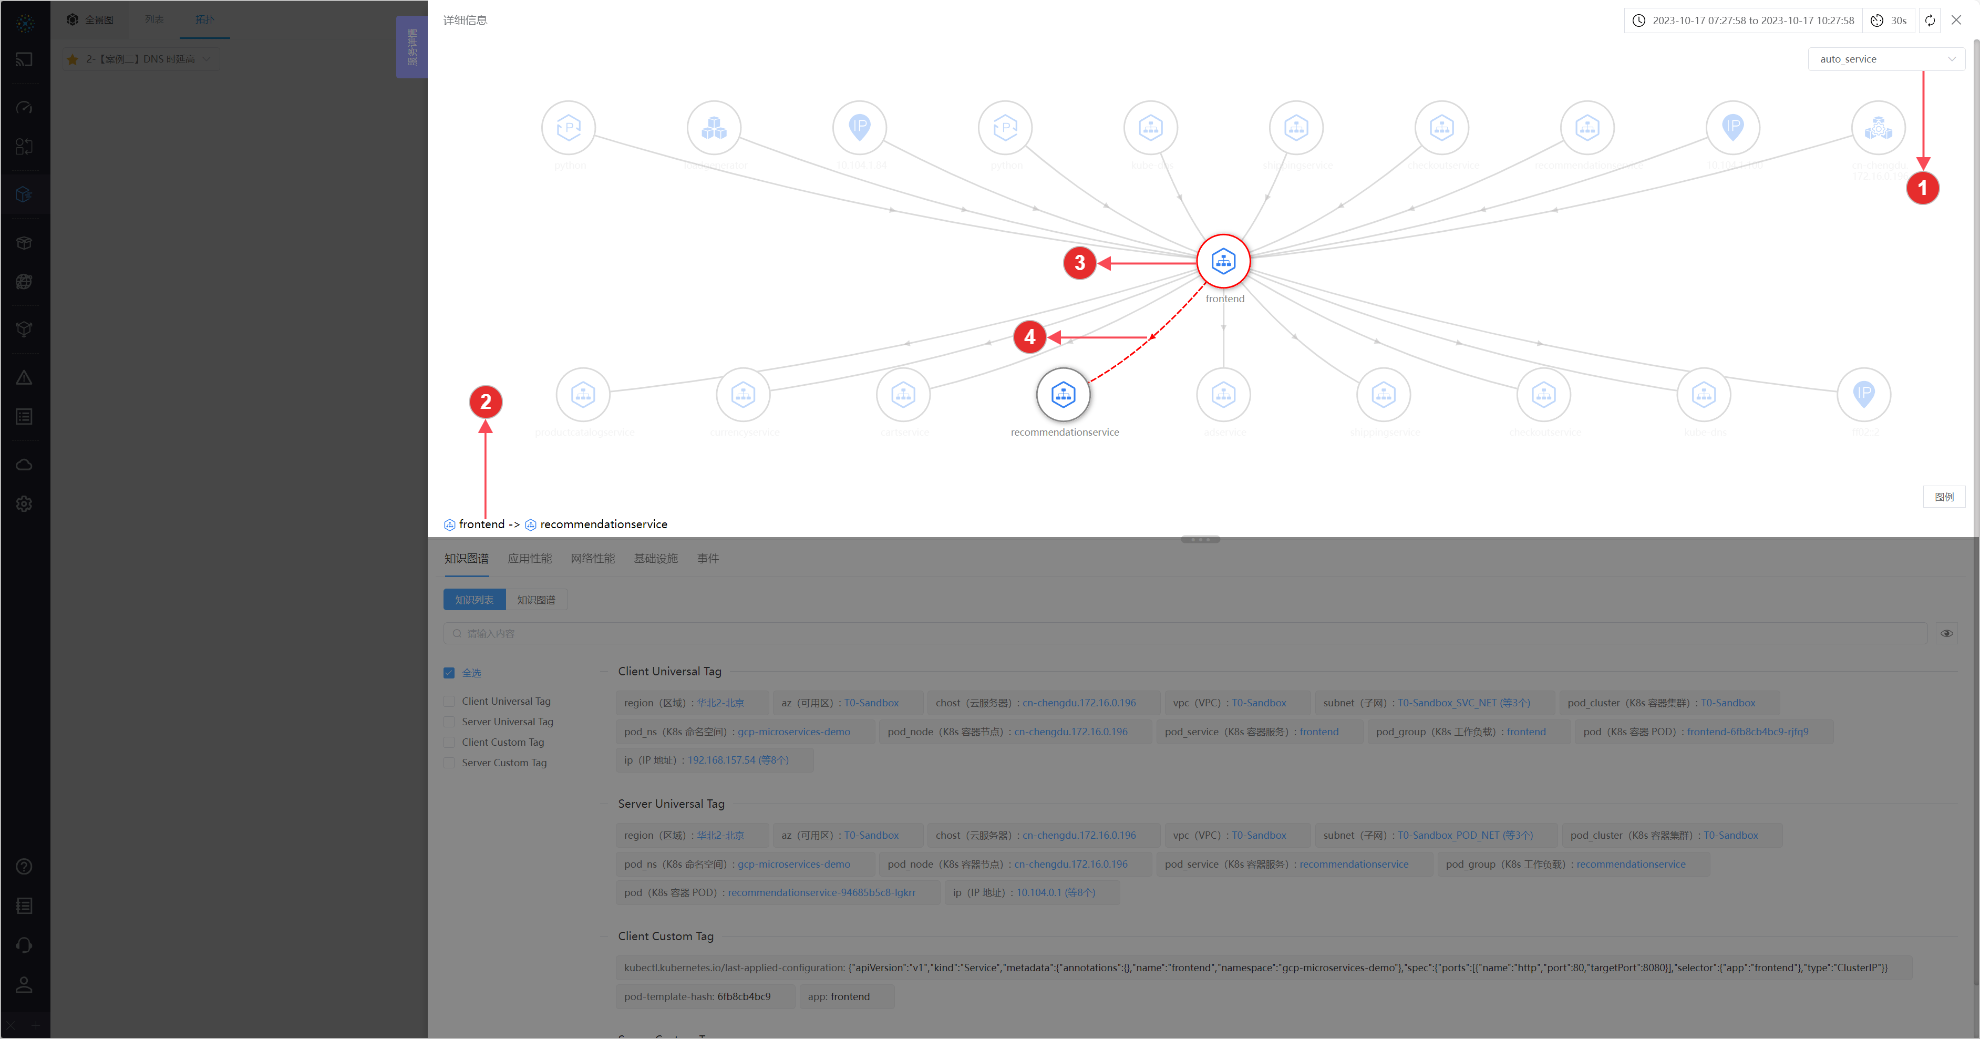
Through Invocation Topology, you can view the client and server of the selected service, and also view the selected path.
02-Invocation Topology
- ① Switch Group: You can view the Invocation Topology from *, auto_service, auto_instance three dimensions
- ② Name: The name of the currently clicked
serviceorpath, corresponding to the object viewed by the lower TAB. - ③ Node: Refer to Traffic Topology for introduction
- ④ Path: Refer to Traffic Topology for introduction
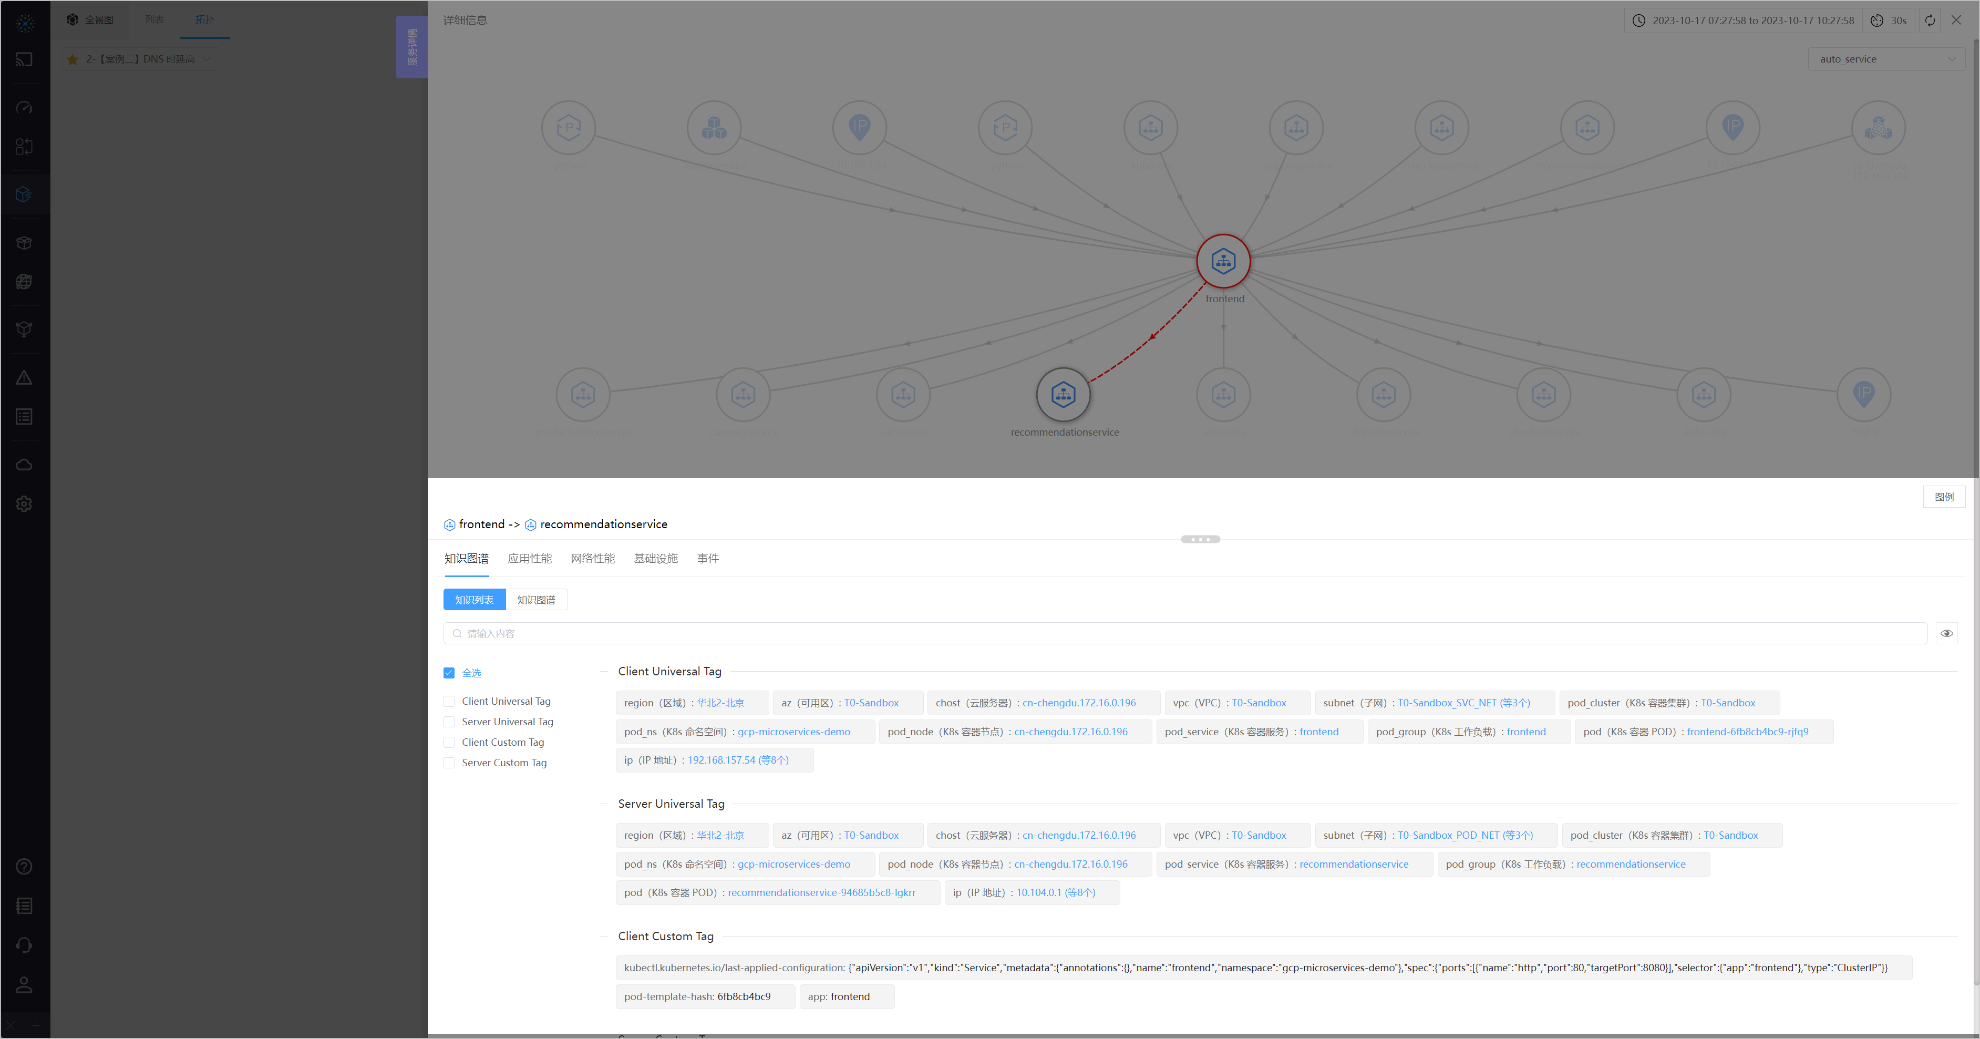
# 1.1.2 Knowledge Graph
03-Knowledge Graph
Refer to Application - Right Slide Box - Knowledge Graph for introduction
# 1.1.3 Application Performance
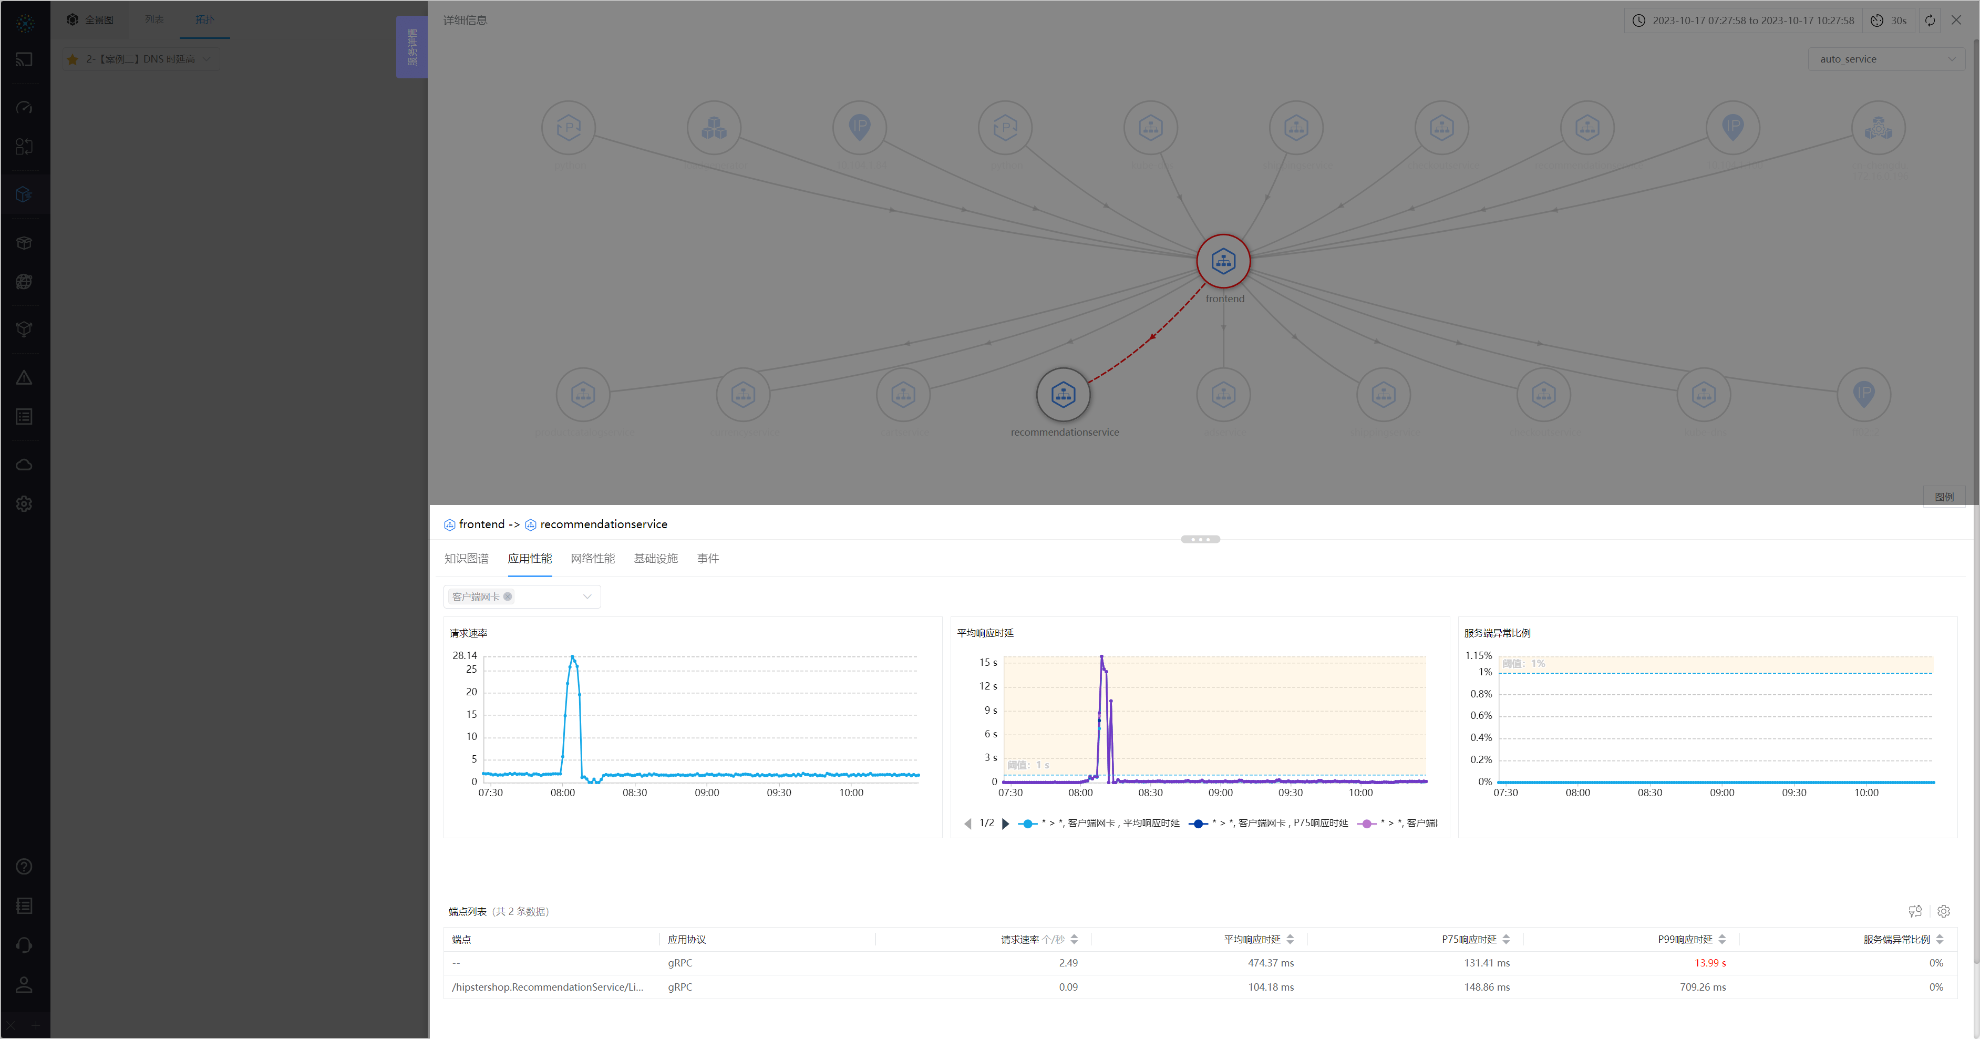
You can utilize Application Performance to analyze whether there are abnormalities in the application layer of the selected service or path.
04-Application Performance
The TAB consists of throughput, latency, exception three curves, and the endpoint list below. Click on a row in the endpoint list to go to the next level right slide box.
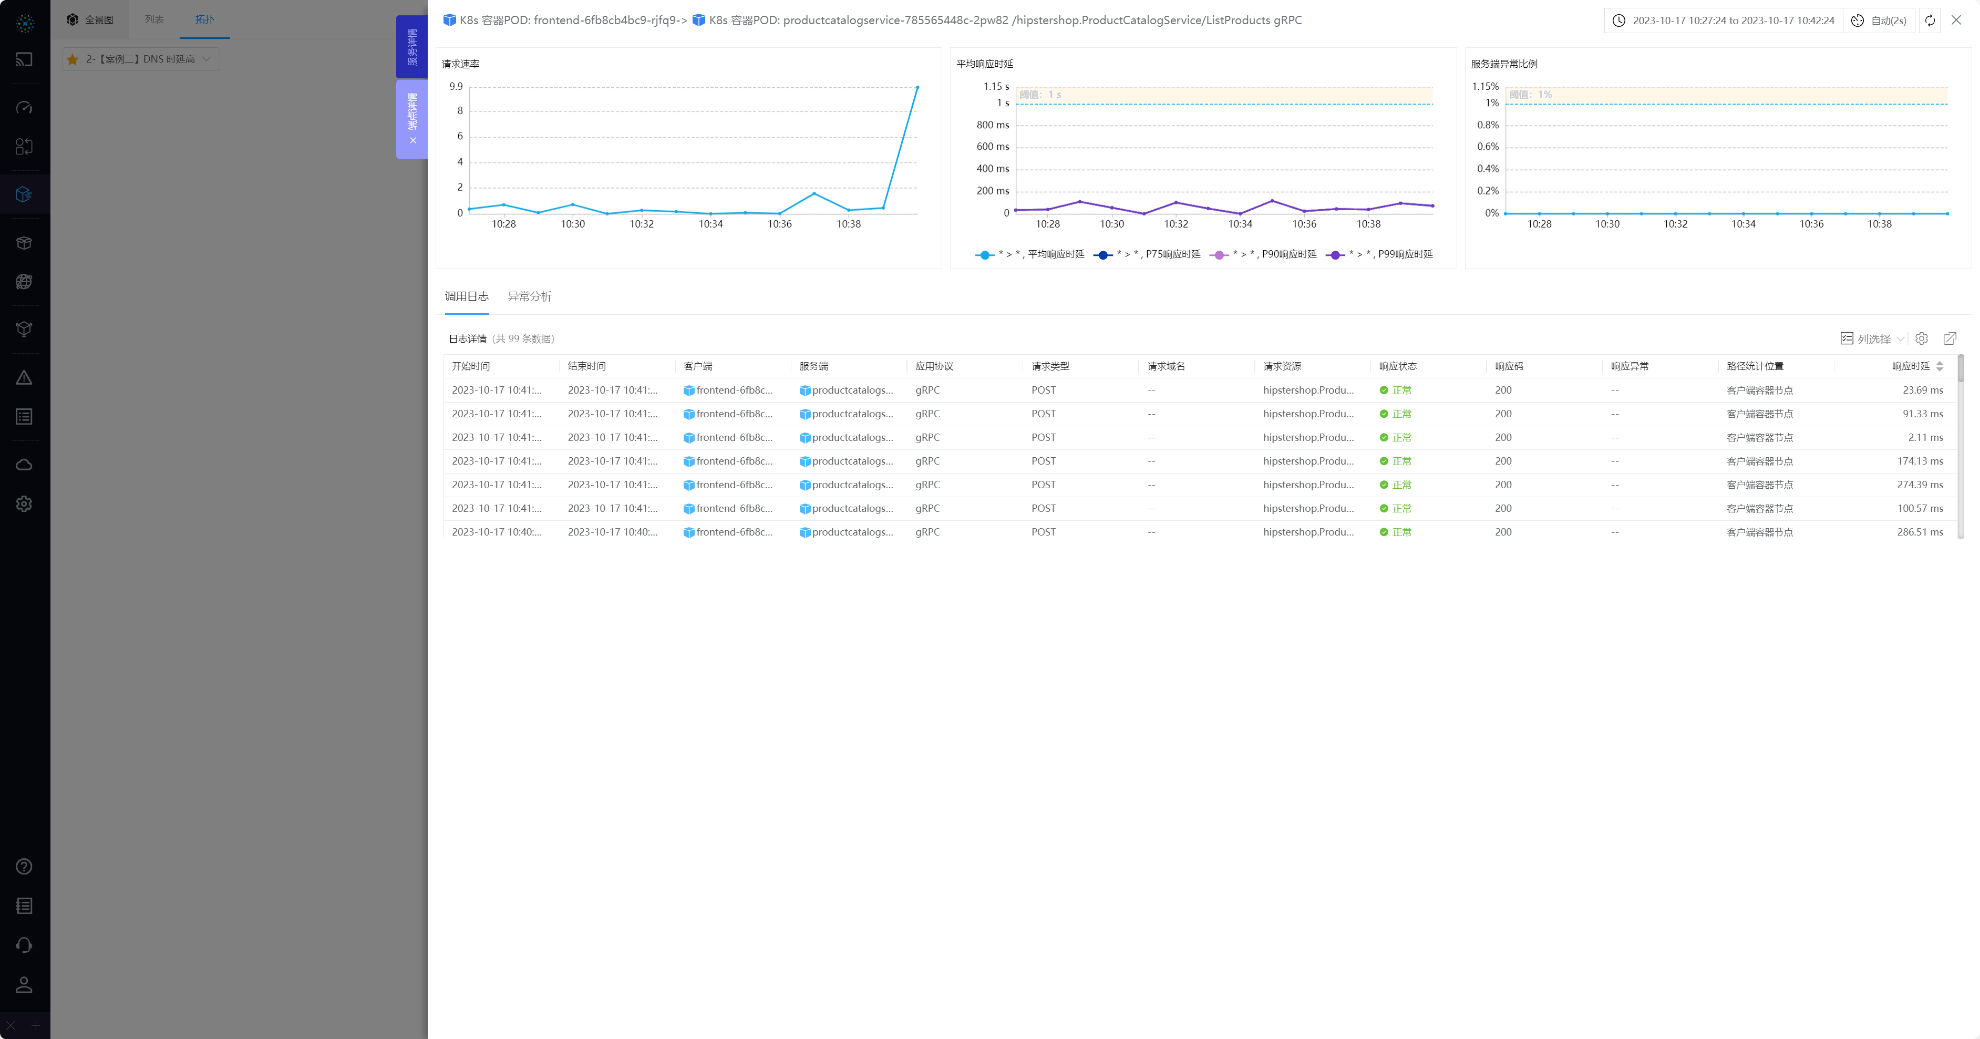
04-1-Application Performance

04-2-Application Performance
The next-level right slide box can view the RED metrics and log details of an endpoint. When an exception occurs, you can view Exception Analysis.
# 1.1.4 Network Performance
You can utilize Network Performance to analyze whether there are abnormalities in the application layer of the selected service or path.
05-Network Performance
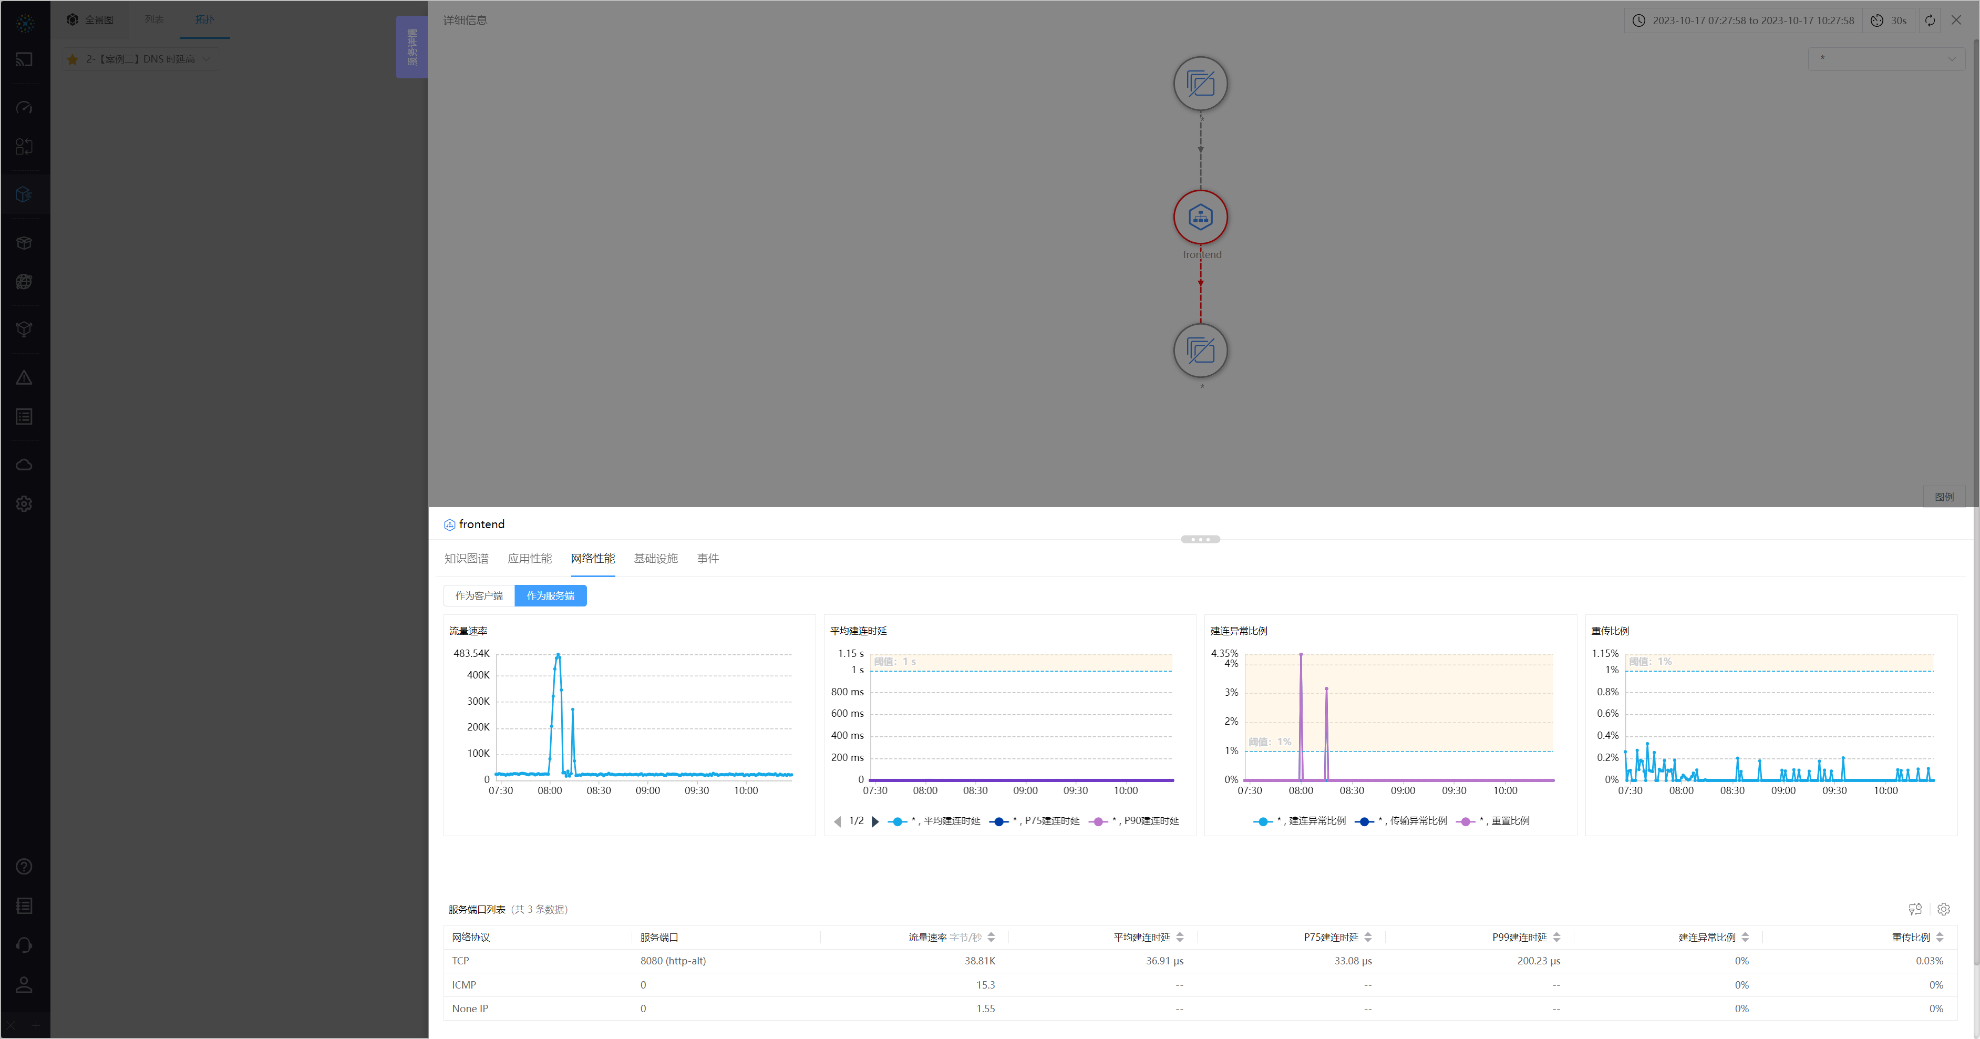
The TAB consists of throughput, latency, exception, performance four curves, and the service port list below. Click on a row in the list to go to the next level right slide box.
- Service: You can view the data of the service
acting as a clientoracting as a server - Path: By clicking each
path statistical locationon thePath Topology, you can view the data of eachpath statistical location
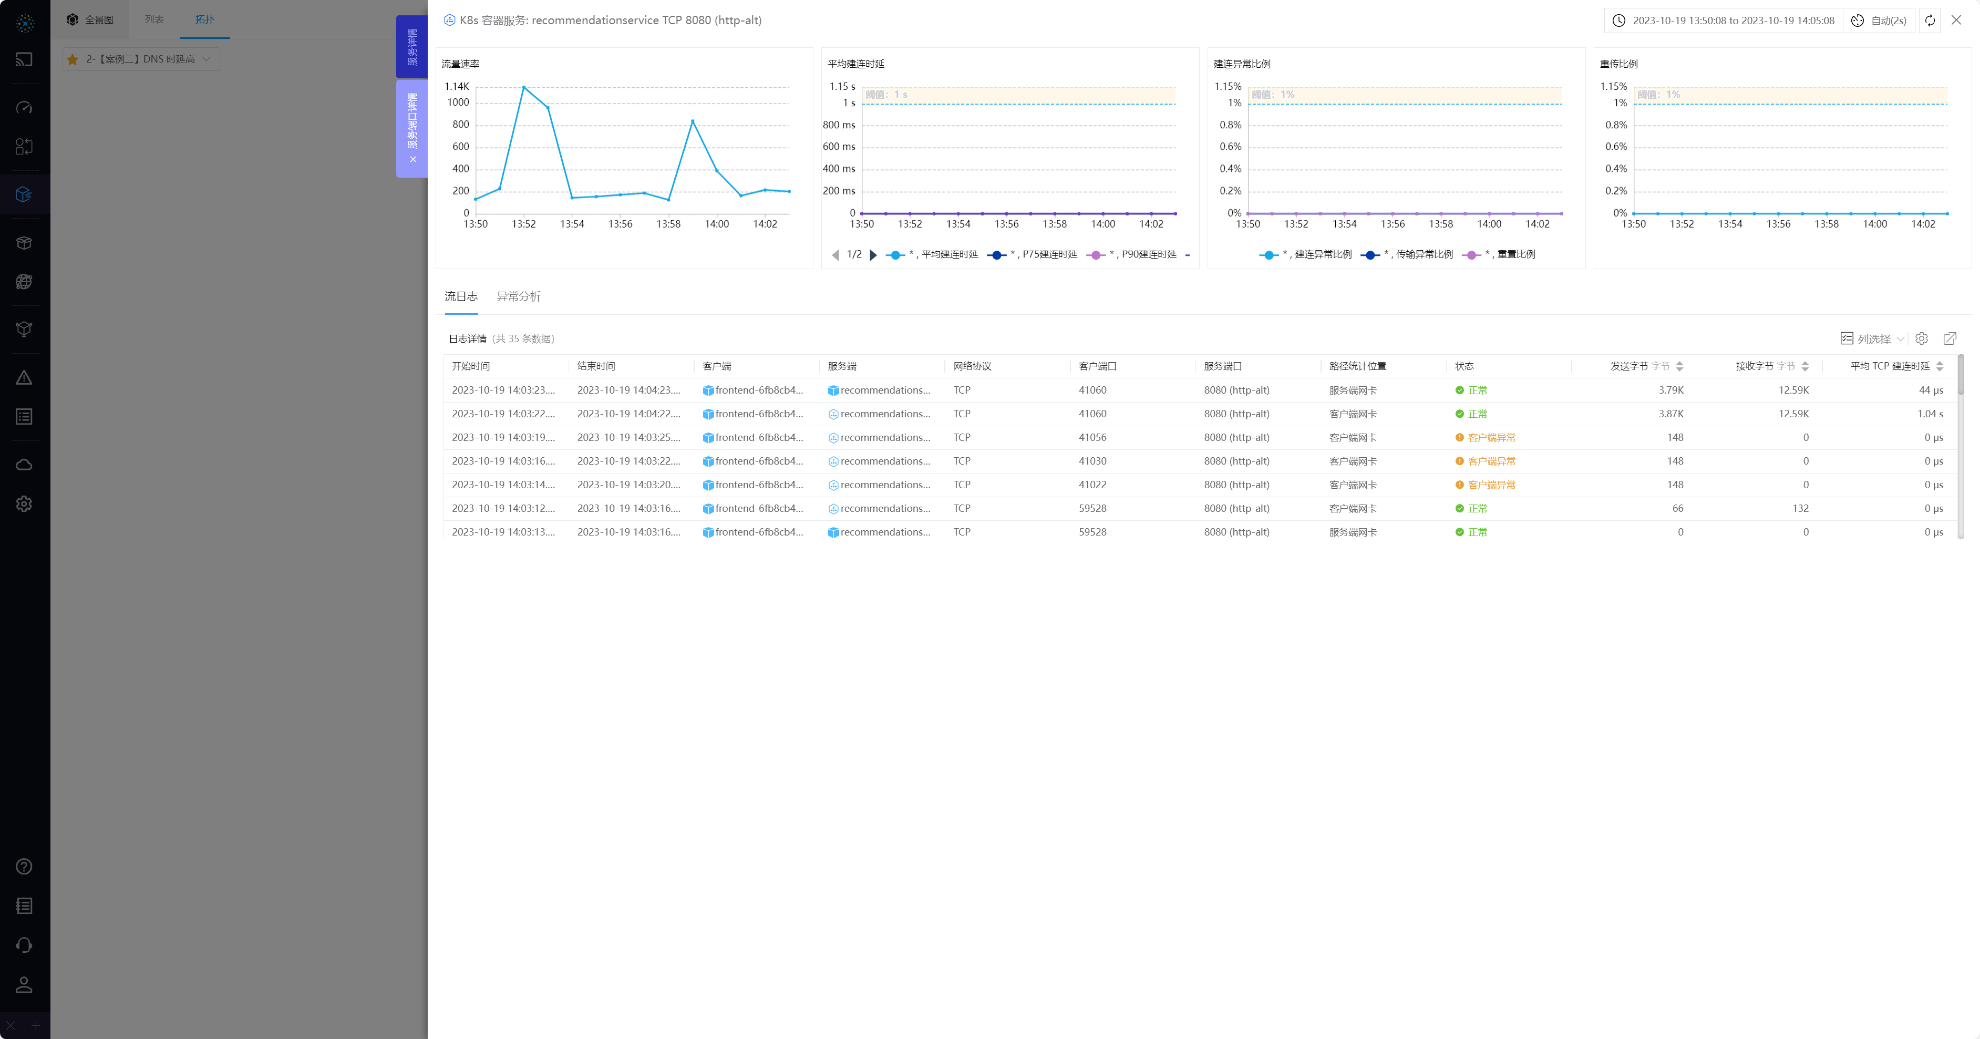
05-1-Network Performance

05-2-Network Performance
The next-level right slide box can view the RED metrics and log details of a service port. When an exception occurs, you can view Exception Analysis.
# 1.1.5 Events
Check the resource change events of services or paths
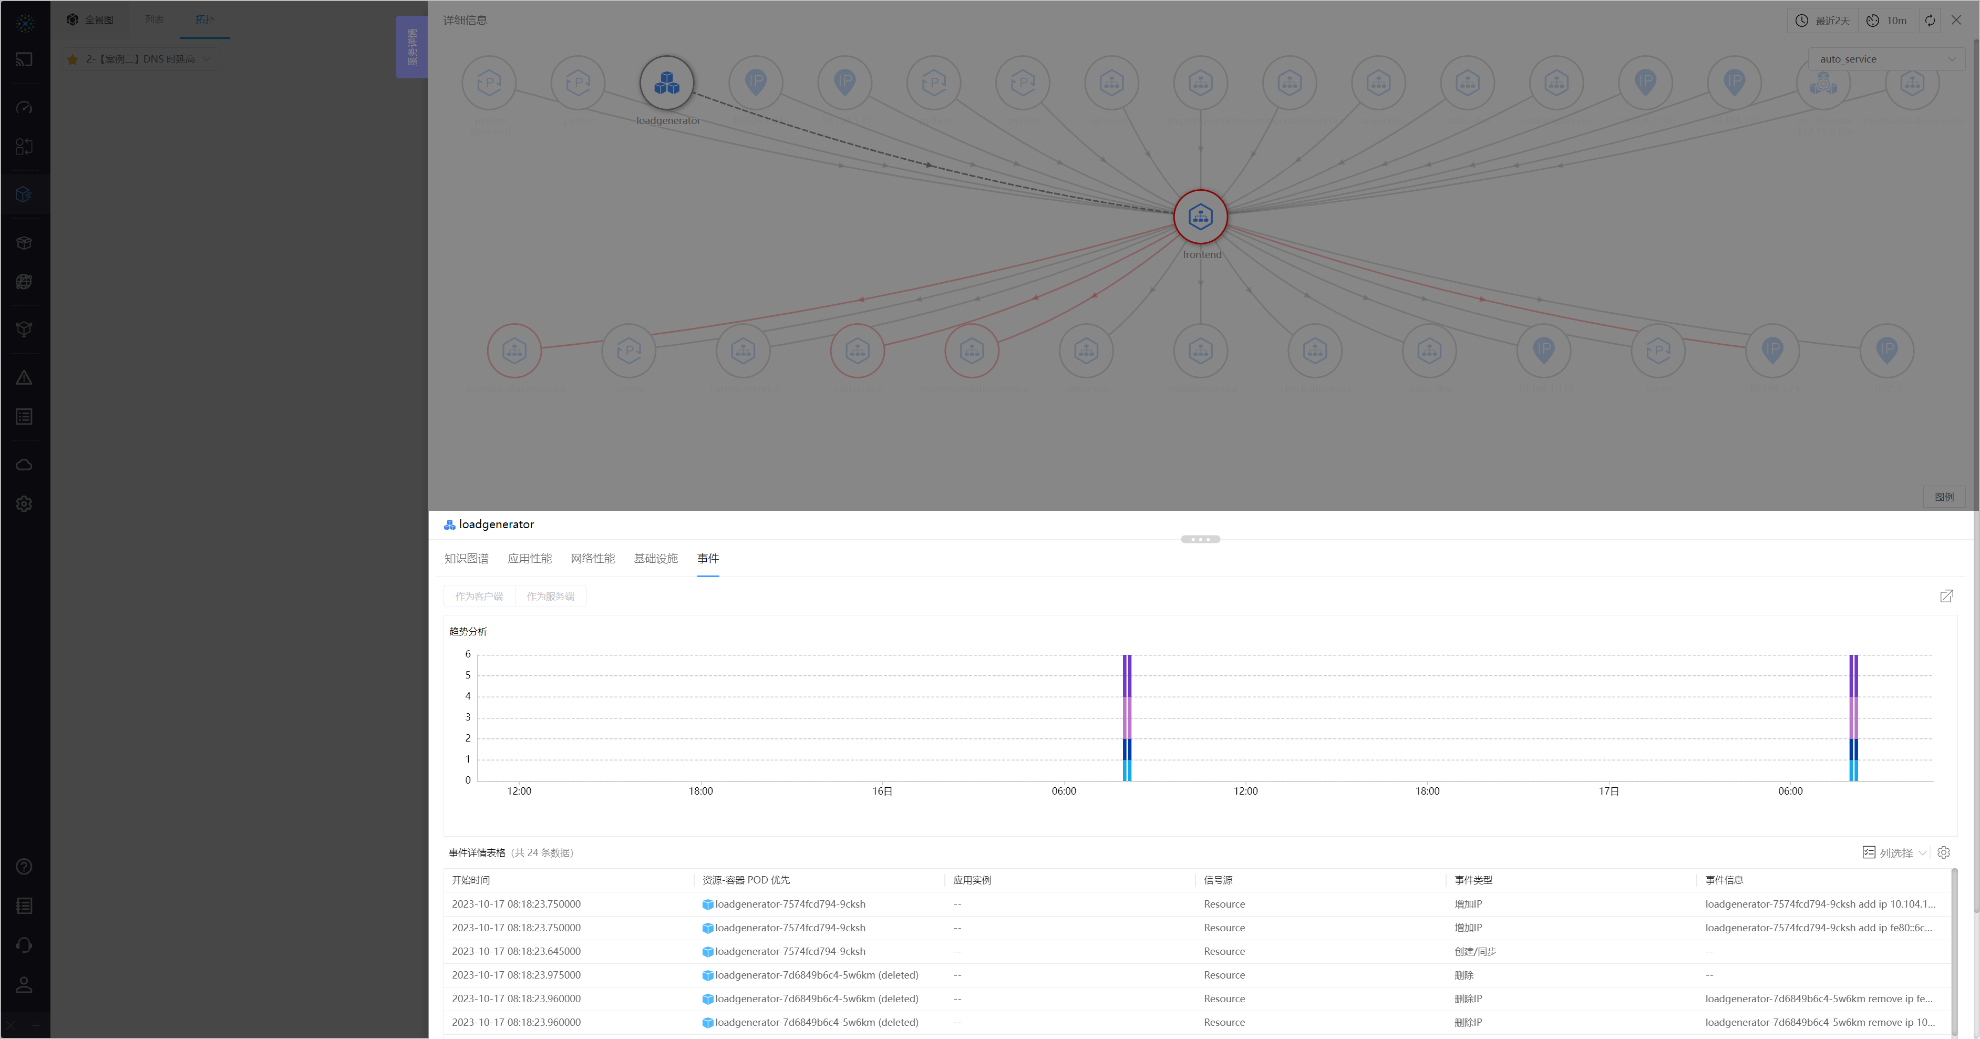
06-Events
Refer to Application - Right Slide Box - Events for introduction