


 Importing OpenTelemetry Data
This document was translated by GPT-4
# 1. Data Flow
Send to deepflow-agent via otel-collector:
Directly send to deepflow-agent:
# 2. Configuring OpenTelemetry
We recommend sending trace data to deepflow-agent using otel-collector in agent mode to avoid data transmission across K8s nodes. However, using otel-collector in gateway mode is also perfectly viable. The following document describes deployment and configuration methods using otel-agent as an example.
# 2.1 Installing otel-agent
Check OpenTelemetry Documents (opens new window) for background information.
If OpenTelemetry is not already setup in your environment, you can quickly deploy an otel-agent DaesmonSet in the open-telemetry namespace using the following command:
kubectl apply -n open-telemetry -f https://raw.githubusercontent.com/deepflowio/deepflow-demo/main/open-telemetry/open-telemetry.yaml
Once installed, you can view a list of components within your environment:
kubectl get all -n open-telemetry
| Type | Component |
|---|---|
| Daemonset | otel-agent |
| Service | otel-agent |
| ConfigMap | otel-agent |
If you need to use other versions or updated opentelemetry-collector-contrib, please find the image version you want in the otel-docker (opens new window) repository, then update the image using the following command:
LATEST_TAG="xxx"  # FIXME

kubectl set image -n open-telemetry daemonset/otel-agent otel-agent=otel/opentelemetry-collector-contrib:${LATEST_TAG}
2
3
# 2.2 Configuring otel-agent
We need to configure otel-agent-config.exporters.otlphttp in otel-agent ConfigMap to send traces to DeepFlow. First, query the current configuration:
kubectl get cm -n open-telemetry otel-agent-conf -o custom-columns=DATA:.data | \
    grep -A 5 otlphttp:
2
The deepflow-agent uses ClusterIP Service to receive traces, modify the otel-agent configuration as follows:
otlphttp:
  traces_endpoint: 'http://deepflow-agent.deepflow/api/v1/otel/trace'
  tls:
    insecure: true
  retry_on_failure:
    enabled: true
2
3
4
5
6
In addition, to ensure the IP of the Span sender is passed on to DeepFlow, we need to add the following configuration:
processors:
  k8sattributes:
  resource:
    attributes:
      - key: app.host.ip
        from_attribute: k8s.pod.ip
        action: insert
2
3
4
5
6
7
Finally, in the service.pipeline, add the following to the traces section:
service:
  pipelines:
    traces:
      processors: [k8sattributes, resource] # Ensure the k8sattributes processor is processed first
      exporters: [otlphttp]
2
3
4
5
# 3. Configuring DeepFlow
Next, we need to start the data receiving service of the deepflow-agent.
Firstly, we confirm the collector group ID of deepflow-agent, which is usually the ID of a group called 'default':
deepflow-ctl agent-group list
Check if the collector group has a configuration:
deepflow-ctl agent-group-config list
If there is a configuration, export it to a yaml file for modification:
deepflow-ctl agent-group-config list <your-agent-group-id> -o yaml > your-agent-group-config.yaml
Modify the yaml file to ensure the following configuration items are present:
vtap_group_id: <your-agent-group-id>
external_agent_http_proxy_enabled: 1   # required
external_agent_http_proxy_port: 38086  # optional, default 38086
2
3
Update the configuration of the collector group:
deepflow-ctl agent-group-config update <your-agent-group-id> -f your-agent-group-config.yaml
If the collector group does not have a configuration, the following command can be used to create a new configuration based on the your-agent-group-config.yaml file:
deepflow-ctl agent-group-config create -f your-agent-group-config.yaml
# 4. Experience based on the Spring Boot Demo
# 4.1 Deploying the Demo
This demo is from this GitHub repository (opens new window). It is a WebShop application composed of five microservices written in Spring Boot. Its architecture is as follows:
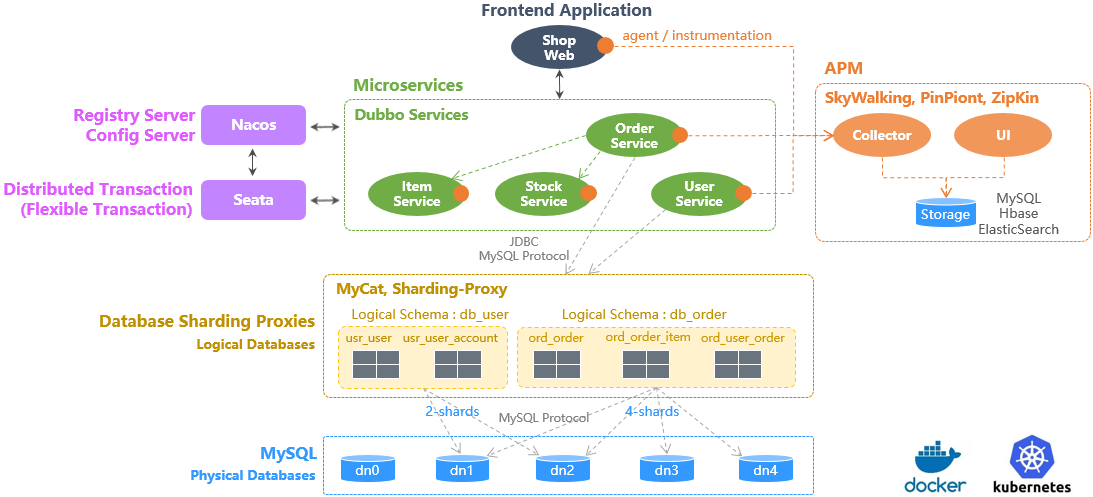
Sping Boot Demo Architecture
The following command can be used to deploy this demo in one click:
kubectl apply -n deepflow-otel-spring-demo -f https://raw.githubusercontent.com/deepflowio/deepflow-demo/main/DeepFlow-Otel-Spring-Demo/deepflow-otel-spring-demo.yaml
# 4.2 Viewing Tracing Data
Go to Grafana, open the Distributed Tracing Dashboard, after selecting namespace = deepflow-otel-spring-demo, you can select a call to trace. DeepFlow can associate and display the trace data obtained from OpenTelemetry, eBPF, and BPF in a flame graph of Trace, covering the full-stack call path of a Spring Boot application, from business code, system functions, and network interfaces, achieving real distributed tracing. The effect is as follows:

OTel Spring Demo
You can also visit DeepFlow Online Demo (opens new window) to see the effect. The topology corresponding to the call chain flame graph in the picture above is as follows.
Summarizing this tracing demo, we conclude:
- Full link: Integrated OTel, eBPF, and BPF, the Trace automatically traced 100 spans, including 20 eBPF spans and 34 BPF spans.
- Full link: For uninstrumentable OTel services, it supports eBPF-based automatic tracing and supplementation, such as span 1-6 (loadgenerator), etc.
- Full link: For services that cannot be instrumented by OTel, it supports eBPF-based automatic tracing and supplementation, such as span 67, 100's eBPF span depicting the start and end of the MySQL transaction (SET autocommit, commit).
- Full stack: Supports tracing of the network path between two pods on the same K8s Node, such as spans 91-92, etc.
- Full stack: Supports tracing of the network path between two pods across K8s Nodes, even if the tunnel encapsulation is passed through in the middle, such as spans 2-5, etc. (IPIP tunnel encapsulation).
- Full Stack: eBPF and BPF spans are interspersed between OTel spans, connecting applications, systems, and networks. The significant time difference between eBPF span 12,27,41,53 and their parent span (OTel) can be used to determine the real performance bottleneck, avoiding confusion in the upstream and downstream application development teams.
# 5. Experience based on OpenTelemetry WebStore Demo
# 5.1 Deploying the Demo
This demo is from opentelemetry-webstore-demo (opens new window), a demo made up of a dozen microservices implemented in languages like Go, C#, Node.js, Python, Java, among others. Its application architecture is as follows:
Use the following command to deploy this demo in one click:
kubectl apply -n deepflow-otel-grpc-demo -f https://raw.githubusercontent.com/deepflowio/deepflow-demo/main/DeepFlow-Otel-Grpc-Demo/deepflow-otel-grpc-demo.yaml
# 5.2 Viewing Tracing Data
Go to Grafana, open the Distributed Tracing Dashboard, after selecting namespace = deepflow-otel-grpc-demo, you can select a call to trace. DeepFlow can associate and display the trace data obtained from OpenTelemetry, eBPF, and BPF in a flame graph of Trace, covering a multilanguage application from business code, system functions, and network interfaces, achieving real distributed tracing. The effect is as follows:

OTel gRPC Demo
You can also visit DeepFlow Online Demo (opens new window) to see the effect.